
Fichier:Atmospheric Transmission.png

Original Fichier (850 × 857 Pixel, Fichiersgréisst: 75 KB, MIME-Typ: image/png)

|
File:Atmospheric Transmission-en.svg ist eine vektorisierte Version dieses Bildes. Diese sollte an Stelle des Rasterbildes verwendet werden, sofern sie nicht schlechter ist.
File:Atmospheric Transmission.png → File:Atmospheric Transmission-en.svg
Für weitere Informationen siehe Help:SVG. |
 |
Transwiki approved by: w:en:User:Dmcdevit
This image was copied from wikipedia:en. The original description was:
Resumé
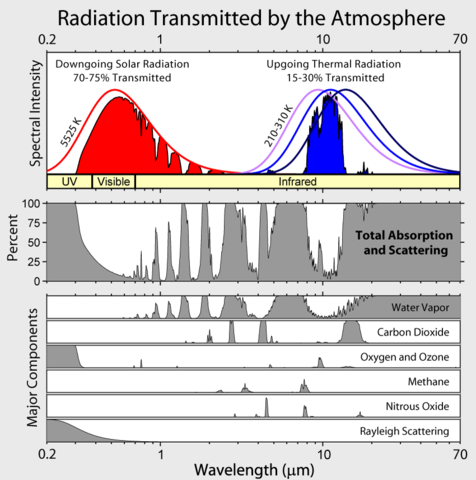
This figure shows the absorption bands in the Earth's atmosphere (middle panel) (when there are no clouds present: clouds average 60-65% cover and independently impact radiation transfer) and the effect that this has on both solar radiation and upgoing thermal radiation (top panel). Individual absorption spectrum for major greenhouse gases plus Rayleigh scattering are shown in the lower panel.
Both the Earth and the Sun emit electromagnetic radiation (e.g. light) that closely follows a blackbody spectrum, and which can be predicted based solely on their respective temperatures. For the Sun, these emissions peak in the visible region and correspond to a temperature of ~5500 K. Emissions from the Earth vary following variations in temperature across different locations and altitudes, but always peak in the infrared.
The position and number of absorption bands are determined by the chemical properties of the gases present. In the present atmosphere, water vapor is the most significant of these greenhouse gases, followed by carbon dioxide and various other minor greenhouse gases. In addition, Rayleigh scattering, the physical process that makes the sky blue, also disperses some incoming sunlight. Collectively these processes capture and redistribute 25-30% of the energy in direct sunlight passing through the atmosphere. By contrast, the greenhouse gases capture 70-85% of the energy in upgoing thermal radiation emitted from the Earth surface.
Data sources and notes
The data used for these figures is based primarily on Spectral Calculator of GATS, Inc. Archivkopie in der Wayback Machine which implements the LINEPAK system of calculating absorption spectra (Gordley et al. 1994) from the HITRAN2004 (Rothman et al. 2004) spectroscopic database. To aid presentation, the absorption spectra were smoothed. Features with a bandwidth narrower than 0.5% of their wavelength may be obscured.
Calculations were done on the assumption of direct vertical transmission through an atmosphere with gas concentrations representative of modern day averages. In particular, absorption would be greater for radiation traveling obliquely through the atmosphere as it would encounter more gas.
The total scattering and absorption curve includes only the components indicated in the lower panel. These represent the vast majority of absorption contributing to the greenhouse effect and follow the treatment of Peixoto and Oort (1992), but other minor species such as carbon monoxide, nitric oxide and chloroflourocarbons (CFCs) have been omitted. Also omitted was scattering due to aerosols and other sources besides Rayleigh scattering.
The peaks in the blackbody spectra were adjusted to have the same height for ease in presentation.
Copyright
This figure was prepared by Robert A. Rohde for the Global Warming Art project.

|
Et ass erlaabt, dëse Fichier ënner de Bedingunge vun der GNU-Lizenz fir fräi Dokumentatioun, an der Versioun 1.2 oder enger spéiderer Versioun, verëffentlecht vun der Free Software Foundation, ze kopéieren, ze verbreeden an/oder zu modifizéieren, ouni onverännerlech Abschnitter, Ëmschlagtext virdrun, Ëmschlagtext hannendrun. De kompletten Text vun der Lizenz ass am Kapitel GNU-Lizenz fir fräi Dokumentatioun ze gesinn. |
| Dëse Fichier ass ënner der Creative Commons Attribution-Share Alike 3.0 Unported Lizenz disponibel. | ||
| ||
| Dës Lizenz-Markéierung gouf bei dëse Fichier dobäigesat als Deel vun der GFDL Lizenz-Aktualisatioun. |
References
- Gordley, Larry L., Benjamin T. Marshall, Allen D. Chu (1994). "LINEPAK: Algorithms for modeling spectral transmittance and radiance". Journal of Quantitative Spectroscopy & Radiative Transfer 52 (5): 563-580. DOI:10.1016/0022-4073(94)90025-6.
- L.S. Rothman, D. Jacquemart, A. Barbe, D. Chris Benner, M. Birk, L.R. Brown, M.R. Carleer, C. Chackerian Jr., K. Chance, L.H. Coudert, V. Dana, V.M. Devi, J.-M. Flaud, R.R. Gamache, A. Goldman, J.-M. Hartmann, K.W. Jucks, A.G. Maki, J.-Y. Mandin, S.T. Massie, J. Orphal, A. Perrin, C.P. Rinsland, M.A.H. Smith, J. Tennyson, R.N. Tolchenov, R.A. Toth, J. Vander Auwera, P. Varanasi, G. Wagner (2004). "The HITRAN 2004 molecular spectroscopic database". Journal of Quantitative Spectroscopy & Radiative Transfer 96: 139-204.
- Peixoto, Jose P. and Abraham H. Oort (1992) Physics of Climate, Springer ISBN: 0883187124.
Other versions
[]
.svg:
-
 Englesch .svg
 -
 Franséisch .svg
 -
 Mazedonesch .svg
 -
 Russesch .svg
 -
 Koreanesch .svg


.png:
-
 Englesch .png
 -
 Franséisch .png
 -
 Polnesch .png
 -
 Japanesch .png
 -
 Arabesch .png


Original-Logbuch vum Eroplueden
| date/time | username | resolution | size | edit summary |
|---|---|---|---|---|
| 22:55, 13 June 2007 | w:en:User:Dragons flight | 850×857 | 76,567 | ({{GWArt}}) |
Image description page history
| link | date/time | username | edit summary |
|---|---|---|---|
| http://en.wikipedia.org/w/index.php?title=Image:Atmospheric_Transmission.png&redirect=no&oldid=138013407 | 08:22, 25 August 2007 | w:en:User:Dmcdevit | |
| http://en.wikipedia.org/w/index.php?title=Image:Atmospheric_Transmission.png&redirect=no&oldid=138013407 | 23:00, 13 June 2007 | w:en:User:Dragons flight | |
| http://en.wikipedia.org/w/index.php?title=Image:Atmospheric_Transmission.png&redirect=no&oldid=138012501 | 22:55, 13 June 2007 | w:en:User:Dragons flight | ({{GWArt}}) |
| Bildnotizen | Diese Datei ist annotiert: Betrachte diese auf Commons. |
Versiounen
Klickt op e bestëmmten Zäitpunkt fir déi respektiv Versioun vum Fichier ze kucken.
| Versioun vum | Miniaturbild | Dimensiounen | Benotzer | Bemierkung | |
|---|---|---|---|---|---|
| aktuell | 09:24, 25. Aug. 2007 | | 850 × 857 (75 KB) | BetacommandBot | Transwiki approved by: w:en:User:Dmcdevit This image was copied from wikipedia:en. The original description was: == Description == [[w:en:Image:Greenhouse Effect.png|thumb|right|300px|Shows how the absorption and recycling of energy by the atmosphe |
Benotze vu Fichieren
Dës Säit benotzt dëse Fichier:
Globaalt Benotze vum Fichier
Dës aner Wikie benotzen dëse Fichier:
- Benotzt op bg.wikipedia.org
- Benotzt op bn.wikipedia.org
- Benotzt op ca.wikipedia.org
- Benotzt op cs.wikipedia.org
- Benotzt op de.wikipedia.org
- Benotzt op de.wikiversity.org
- Benotzt op el.wikipedia.org
- Benotzt op en.wikipedia.org
- Benotzt op en.wikibooks.org
- Benotzt op en.wikiversity.org
- Benotzt op es.wikipedia.org
- Benotzt op fr.wikipedia.org
- Benotzt op gu.wikipedia.org
- Benotzt op he.wikipedia.org
- Benotzt op hr.wikipedia.org
- Benotzt op id.wikipedia.org
- Benotzt op ms.wikipedia.org
- Benotzt op nn.wikipedia.org
- Benotzt op no.wikipedia.org
- Benotzt op ro.wikipedia.org
- Benotzt op sh.wikipedia.org
- Benotzt op si.wikipedia.org
- Benotzt op ta.wikipedia.org
- Benotzt op te.wikipedia.org
- Benotzt op th.wikipedia.org
- Benotzt op ur.wikipedia.org